Research Interests
My main interest is the integration of data from a variety of geophysical
techniques in the investigation of geologic problems at all scales. Other interests
include but are not limited to the development and application of signal processing
techniques for data enhancement in the geosciences, and the development and practical
application of high resolution '4-D' geophysical methods in the engineering and
environmental sciences.
-

-
-
ANALYSIS OF A POSSIBLE NEOTECTONIC FEATURE IN SW VIRGINIA USING
POTENTIAL FIELD ATTRIBUTES (PFA)
Peavy, Samuel T., Dept. of Geological Sciences, Rutgers University, 195 University
Ave., Newark, NJ 07102, peavy@andromeda.rutgers.edu; Sayer, Suzanne, College of
Engineering, Virginia Polytechnic Institute and State University, Blacksburg, VA 24061,
ssayer@vt.edu.
New River terrace deposits near Pembroke in southwestern Virginia were
discovered to contain an antiform and several faults during the excavation of an
embankment in 1992. The central portion of the antiform was found to contain a narrow
graben striking ENE to NE. The location of Pembroke within the Giles County Seismic Zone
led to a consideration that these young faults might be associated with an active fault in
the basement. However, the terrace has numerous sinkholes from dissolution of the
underlying Ordovician carbonates, and the faults could be the result of the collapse of a
deeper karst feature. A geologic and geophysical investigation was undertaken with the
purpose of finding the root cause of the younger faulting.
Seismic refraction, roll-along electrical resistivity, terrain
conductivity, magnetometer, and gravity surveys near the embankment and in a large hay
field across US Highway 460 from the embankment were performed. The seismic refraction
results indicated that as much as 134 feet of terrace deposits overlie the carbonate
basement, and the roll-along resistivity was able to track the trend of the graben into
the hay field. Initial analysis of the terrain conductivity, gravity and magnetic data
indicated that the trend established by the resistivity surveys might extend more than
1000 feet from the embankment. However, this trend appears to be terminated by an
east-west alignment of anomalies. No clear link to possible basement faulting could be
established, however.
Further analysis of the gravity and magnetic anomalies was undertaken
using a combination of gradient methods known collectively as potential field attributes
(PFA), which more clearly delineates the established trends allowing for better
interpretation of the results. PFA may prove useful in the analysis of other data sets of
similar nature. [Note: Further analysis indicates that the
collapse of a karst-related structure is most likely responsible for the graben structure
-- see below] {Related paper accepted to Geophysics}
{Presented at Northeastern section meeting, GSA, Portland, ME 1998}
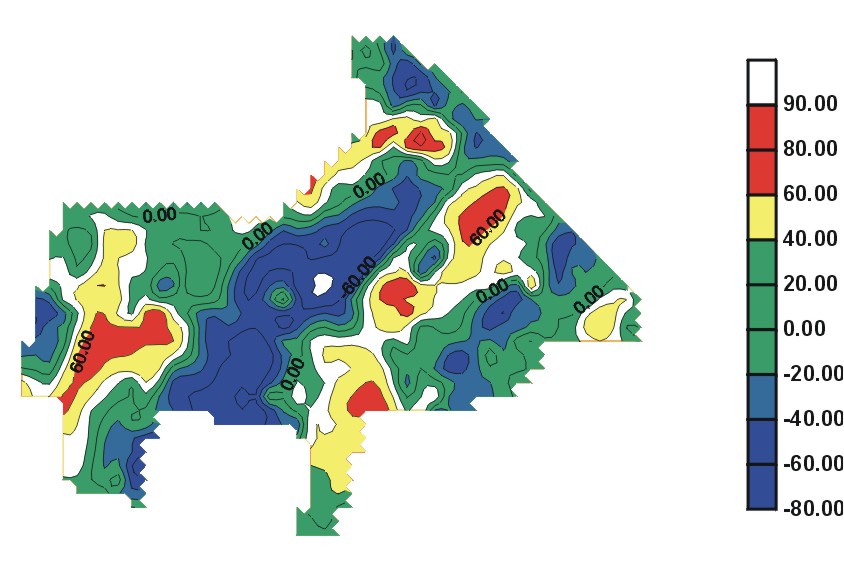
Above: Calculated tilt angle values for gravity field, Pembroke, Virginia.
Northeast trending negative (blue) values in tilt angle indicate a low density zone
interpreted to be a karst related collapse, probably associated with the antiform and
graben structure across the street.
VARIABILITY OF ELECTRICAL RESISTIVITY AT THE RICE CREEK FIELD STATION,
OSWEGO, NEW YORK: IMPLICATIONS FOR THE DISTRIBUTION OF GROUNDWATER
Samuel T. Peavy, Dept. of Geological Sciences Rutgers University, 195
University Ave., Newark, NJ 07102, and David W. Valentino, Dept. of Earth Sciences, State
University of New York at Oswego, Oswego, NY 13126
Electrical resistivity measurements were made to determine the
variability of surficial deposits, the depth to bedrock and to characterize the
distribution of groundwater at the Rice Creek Field Station near Oswego, New York. The
field station is underlain by drumlin deposits and ablation till associated with
Pleistocene glaciation. These deposits reside on Ordovician quartz sandstone of the Oswego
Formation that outcrops within 1500 m of the study site. Locally the Oswego Formation
contains subvertical fractures with an average spacing of less than 0.5 m. Twenty offset
Wenner electrical resistivity surveys were conducted in June and August of 1998 along
trails and across an open field within the field station grounds. Analysis of
pseudosections and simple 1-D modeling and 2-D least squares inversion indicate the
following: 1) low resistivity zones associated with perched water tables within the
chaotic drumlin deposits; 2) highly variable and resistive near-surface measurements along
Rice Creek indicative of large (>1 m diameter) glacial erratics as observed in the
creek bed; 3) a transitional zone below ~250 ft elevation of subcircular highs separated
by relatively low resistivities that continue into the deepest portions of the data, which
is coincident with the projected depth to bedrock beneath the field station and is
interpreted to be an undersaturated zone within the fractured Oswego Sandstone; and 4) low
resistivities below an elevation of ~190 ft are interpreted to be the top of the saturated
domain within the fractured bedrock.
{Presented at SAGEEP meeting, Oakland, CA, 1999}
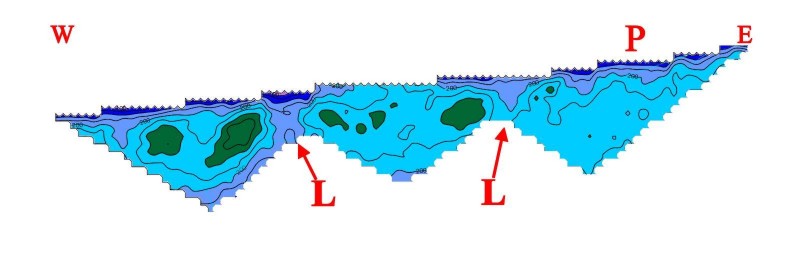
Above: Resistivity map along entry road,
Rice Creek Field Station, Oswego, NY. L shows zones of low
resistivity that continue into the subsurface; P is the location of a
perched water table.
Location and Delineation of Subsurface Tar Contamination Using Electrical
Methods
GRANGER, Elizabeth, and PEAVY, Samuel T., Dept. of Geological Sciences, Rutgers
University, 195 University Ave., Newark, NJ 07102
Electrical resistivity and induced polarization (IP) measurements
were made to explore the variability of electrical parameters within tar-contaminated
soils at a vacant lot on the floodplain of the Oswego River in Fulton, NY. The site was a
shingle manufacturing facility operating from 1936 - 1960. Subsequently, the property was
divided into several partitions and used for the disposal and storage of asphalt and
roofing shingles. Degradation of the buried shingles with time generated diapirs of tar
which eventually extruded onto the surface, creating self-replenishing "tar
boils" at the site.
Data from an original Wenner electrical resistivity survey conducted in
December, 1997 were used to delineate highly resistive areas believed to be associated
with the tar. Subsequent trenching and drilling revealed tar in some of the identified
areas. However, there were also large (> 2m diameter) boulders of Oswego sandstone in
the subsurface, believed to be related to the building of the Oswego Barge Canal. A second
Wenner electrical resistivity survey using a 1-m offset was conducted in December, 1998 to
locate remaining areas of potential tar contamination. These locations were the focus of
IP surveys conducted during May and June of 1999. These surveys were conducted to test the
ability of IP parameters to distinguish between organic and inorganic resistive zones in
the subsurface. Recent publications of laboratory results have indicated that spectral IP
has the potential to identify contaminants through variations in the phase and amplitude
spectra. Derivation of these spectra can be done in the field by fitting time domain IP
data using a Cole-Cole model, then deriving the spectral parameters.
- {Presented at National GSA meeting, Denver, CO 1999}
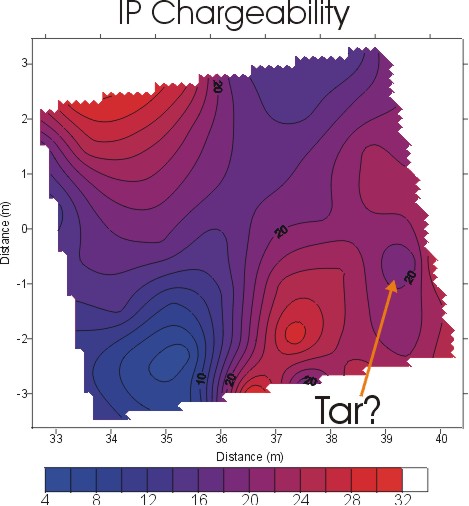
Above: Image of IP data collected in Fulton, NY in 1999 showing
chargeability in mV/V.
- 4-D Imaging
Recent publications have shown the utility of 4-D or time-lapsed seismic imaging in
the evaluation of oil and gas reservoirs around the world (see recent issues of The
Leading Edge, Geophysics, or AAPG Bulletin). The ability to track
the migration of fluids in the subsurface seems promising given recent results. However,
there are problems, including those associated with the use data sets of differing
vintages in the 4-D analysis. Amplitude anomalies notwithstanding, true quantification of
the results still awaits.
In the environmental industry, there have been attempts to do similar imaging of
subsurface contaminant plumes using ground penetrating radar (GPR), electrical, and
electromagnetic methods. Images seem to indicate changes in the subsurface which in some
cases can be associated with contaminant movement. However, variability and seasonal
changes of physical properties in the near-surface have made the quantitative use of this
information difficult to nearly impossible. Victoria Hover and I plan to pursue a study
combining geochemical, geologic, and geophysical information over a relatively small area
in an attempt to reach more quantitative conclusions from a 4-D study using electrical
resistivity.
Induced Polarization Studies
With the able assistance of graduate student Mrs. Elizabeth Granger, we have
undertaken a series of IP measurements at the site of a former shingle factory in Fulton,
NY. "Tar boils" -- presumably derived from buried shingles on-site --
appeared at the surface in several places in a vacant lot. These were investigated
initially by resistivity measurements, and later by trenching. Zones of high
resistivity correlated with subsurface tar and with large boulders of Oswego
sandstone, possibly derived from the building of the nearby Oswego River Barge Canal.
Therefore, we returned to the site to collect IP data in the hope that the data
would show substantial differences between the sandstone boulders and tar diapirs.
Data were collected in the late spring and summer of 1999. The results show that IP
data can resolve the tar diapirs. These results were presented at GSA in Denver last
month (see recent abstracts, above). Further research into
Cole-Cole model parameters and their relationship to the tar are being explored at this
time.
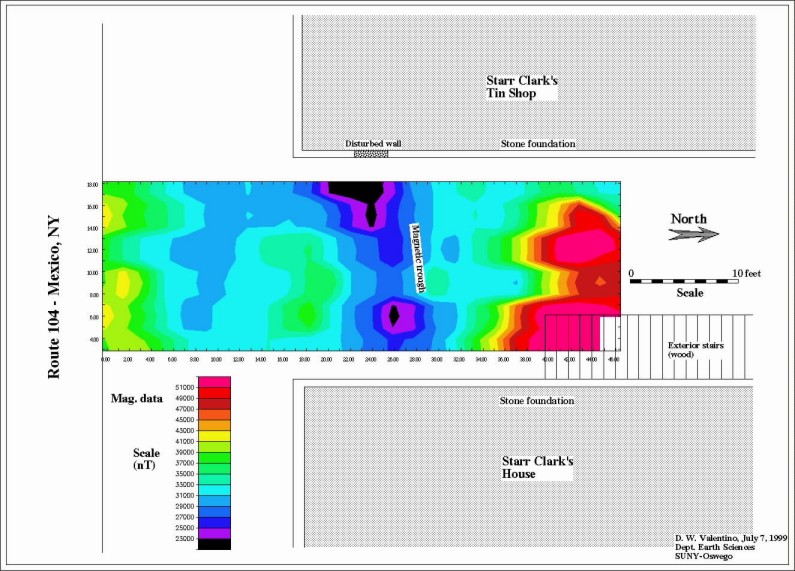
Archeological Investigation, Mexico, NY
Geophysical data were collected in the town of Mexico, New York on June 28-29, 1999
in order to determine the location of a prospective tunnel in the subsurface. The
potential location for the tunnel was in a driveway between two buildings in the town near
the intersection of Highways 104 and 69 at the old Starr Clark place. Starr Clark was a
tinsmith with known abolitionist sentiments. Anecdotal and local historical evidence
suggest that the houses and the tunnel may have been used by slaves during the time of the
"Underground Railroad" to hide from potential captors and affect their escape to
Canada and hence to freedom. The finding of a tunnel on the property would confirm this.
Geophysical methods are often used in archeological work due to their non-invasive nature.
With the able assistance of David and Rick Valentino, a dipole-dipole electrical
resistivity survey and magnetometer survey were conducted. The resistivity was
collected using a 1-m electrode spacing, and the magnetic data at 0.25 m. We were
unable to determine with any certainty if a tunnel exists at the location surveyed.
However, magnetic data indicate a large body of high magnetization and reversed magnetic
polarity at a shallow depth. Models constructed from the data match this
interpretation, but do not indicate with certainty what this object(s?) might be.
Further tests and perhaps drilling would be necessary to ascertain the identity of the
anomaly source.
Other Research Interests
- Study of the Eastern Virginia Geophysical High
(EVGH)
-
- C. Çoruh, J. K. Costain and I have been studying a gravity and magnetic high in
eastern Virginia. Known variously as the Salisbury, Sussex-Currioman Bay,
Sussex-Leonardtown, and Eastern Virginia Geophysical High (EVGH), the anomaly has been a
source of controversy for most of the last 30 years. Two main schools of thought have
prevailed on the origin of the anomaly, with one group maintaining that it represents a
suture zone of possible Taconic- or Alleghanian-age, and the other group relating its
origin to Mesozoic extension. Some authors have suggested that the anomaly trend is
Alleghanian, strengthening their argument that the anomaly indicates a Late Paleozoic
suture zone. However, as the anomaly's source lies beneath Atlantic Coastal Plain
sediments, all geologic evidence collected in the vicinity of the EVGH is a result of
basement penetrating wells. The few wells that have penetrated the basement in the
vicinity of the EVGH display a variety of lithologies ranging from Triassic-aged strata,
phyllite and biotite schist to metavolcanics and possible metamorphosed ultramafics.
- The intermittent nature of the EVGH, particularly its magnetic field, argues against a
single source along strike, but instead would be most consistent with a narrow belt of
multiple sources. Basement refraction surveys yield a velocity of 6.3 km/s in the area of
the EVGH. Well data and basement refraction velocities of 4.0-5.2 km/s to the east and
west of the EVGH are indicative of possible Triassic strata. The USGS I-64 seismic
reflection data show a thickness of up to 6 km for the Toano Basin to the east of the
EVGH. The reflection data also show a narrow (~ 9 km) zone of discontinuous reflectivity
in the mid- to upper crust coincident with the EVGH, a general lack of reflectivity to the
east of the EVGH, and a reflection Moho at ~ 33 km nearby. Time-term analysis of mostly
unreversed refraction profiles by James and others (1968) indicated an increase in crustal
thickness from ~ 35 km just to the west of the EVGH to over 45 km to the east, a result
inconsistent with the the reflection data.
- The increase of crustal thickness from the time-term analysis could be caused by the
presence of the Toano basin, which was unaccounted for in the original calculations. A
recalculation of the depth to the Moho for a 4.5 second time-term using a model that
includes 6 km of Triassic strata at 5.2 km/sec produces a thickness of 39.5 km as opposed
to the value of 46.2 km from the original model. If the effect of the down-dip shooting
geometry of the original experiment is also considered, a reduced time term (0.56 s)
results in a total crustal thickness of 34 km -- a result consistent with the reflection
data.
- Two- and three-dimensional gravity and magnetic modeling show that the EVGH can be
explained by a near-vertical, mafic intrusive complex over a westward dipping Moho with no
increase in crustal thickness . This model is best explained by dike swarms of
Mesozoic age associated with the opening of the Atlantic Ocean and post-dating the
formation of the associated Triassic basins to the east and west. These mafic dikes may
have taken advantage of a pre-existing, near-vertical Alleghanian structure that may have
been associated with transpression during that time. Gates and others (1988) and Valentino
and others (1994) have provided geologic evidence for the existence of a substantial
component of strike-slip during the Alleghanian. With lateral displacements of up to 150
km, some of the larger strike-slip motions may have been associated with through-crustal
zones of deformation. These zones may have been used during the latest phase of Mesozoic
extension as conduits for the mafic material producing the EVGH and other similar
anomalies in the southeastern United States. So in essence, the EVGH, while technically
Mesozoic in age, may indeed be a direct consequence of Alleghanian strike-slip motion.
 Back(to top
  Go To Main Page
- Study of the COCORP GA-16 seismic line
- In a similar study to that above, it was noted by Dr. C. Çoruh that COCORP GA-16 in
southeastern Georgia exhibits a similar reflection and potential field signature to that
in eastern Virginia. The tectonic setting is different, however, as wells in south Georgia
have penetrated Paleozoic sedimentary rocks of African origin, indicating that a real
suture of Alleghanian-age probably exists in this area. The geophysical anomaly seen in
COCORP GA-16, while somewhat different in appearance to the EVGH, can also be modeled
effectively using a near-vertical source for the gravity anomaly. It is our hypothesis
that the origin of the anomaly source is also Mesozoic, but once again relies on a
pre-existing structure to act as a conduit for the mafic material. The difference in
appearance can be explained by a more compressional mode of tectonics in Southeastern
Georgia, forming a suture, versus a strike-slip mode in eastern Virginia. The signature of
an injected suture should be different from that of an injected, through-crustal
strike-slip zone.
- Structural dip limitations on migrated
seismic data
- A study of structural dip limitations in migrated seismic data was undertaken with
the purpose of evaluating the resolution of seismic data in general and deep-crustal
seismic data in particular. For the study, GeoQuest International's AIMS seismic modeling
system was used to 'acquire' CDP data over a simple model of the crust. The model
contained a series of dipping reflectors with dips ranging from 0 to 70 degrees at a depth
of 15 km along a 100 km long profile, and a flat Moho reflector at 33 km depth. A 14-56 Hz
tapered Klauder wavelet was used along with a 5 km maximum offset with an end-on spread
and 48-channels. These values are typical of most deep crustal vibroseis data sets. In
addition, full wave equation modeling was used to better simulate real seismic data, and
noise was added to the final gathers. The resulting nominal 24-fold CDP gathers were
transferred to CogniSeis' DISCO seismic processing package and stacked using the model
velocity of 6 km/s and recording times of 13, 16 and 25 seconds. The stacked data clearly
indicated that the 13- and 16-second stacks were not 'seeing' all the dipping reflectors,
in particular the 60 and 70 degree reflections were either entirely or partially missing
from the stacks. Even the 25-second stack was missing a portion of the 70 degree
reflector. The Moho reflector was distorted slightly by the mid-crustal structure, with
obvious breaks and layering seen in the stack, most likely a result of the complex wave
propagation through the mid-crust. Stacks were also made using a variable maximum offset
of 2.5 to 5.0 km. for all the different recording times.
- The stacks were migrated using two different finite-difference algorithms and a
Kirchhoff algorithm. The shorter data lengths proved to severely limit the dip resolution
of the final migrated section, with the 25-second data giving the best results. In
addition, the finite-difference algorithms produced poorer results for dips > 40
degrees, even though the dip limit was set at 70 degrees. The explanation lies in the way
finite-difference migrations work and the lack of aperture, or number of traces, during
migration. Dipping reflectors are distorted during CDP processing by being lengthened and
spatially and temporally displaced, with higher dip angles being the most affected. The
aperture limitation became the major factor determining the effectiveness of the
finite-difference algorithm. For the Kirchhoff algorithm, this was not a problem, as the
aperture is the entire seismic section. Some dispersive effects were noted in the results
for Kirchhoff migration at the higher dip angles, most probably due to aliasing of the
migration operator caused by a spatial sampling interval (50m) that was too large for
those higher dips. This could be cured by recording at a finer CDP interval, though this
has not been attempted to date. In addition, the time-migrations used in this study are
not able to correct for the complex wave propagation that produced distortions of the
planar Moho reflector. Only pre-stack algorithms can successfully attack this problem, but
the drawback then becomes the accurate determination of velocity at depth, a very daunting
task. Limiting the offset proved to be a minor factor in dip resolution, with more
dispersion occurring at shorter offsets for all the algorithms, possibly due to the
limitation of a different type of aperture - the spatial aperture. Limiting the
spatial aperture limits the frequency band, and larger bandwidths are migrated more
successfully (see Berkhout's books on seismic resolution and seismic migration).
- From the above study, the following conclusions can be made:
- The primary factor determining dip resolution in crustal-scale seismic reflection data
is the recording time. The 'short' recording times of most crustal data sets will limit
the resolution of the steepest dips to the shallowest parts of the section.
- Steep dips deeper in the section require longer and longer recording times to be
resolved, therefore typical crustal data sets (13-16 seconds) probably contain no
information on dips greater that 40 degrees below 15 km (5 seconds), and almost no dip
information at Moho depths, resulting in a time-dependent, dip-filtered version of
reality. As the old saying goes, "If you don't record it, you can't migrate it."
- The aperture limitation of finite-difference algorithms make it impossible to migrate
steep dips successfully for any part of the section below 5 seconds. The Kirchhoff
algorithm is much slower (19 hours vs. < 2 hours on a Sun Sparc10 Workstation), but the
results are more accurate for steeper dips, and hence should be used exclusively for deep
crustal data sets. Any time migration algorithm, however, cannot correct for time
distortions caused by complex wave propagation, and hence will be unable to give a
definitive answer, especially in structurally complex areas. This requires accurate
velocity determination at depth -- a problem as yet unresolved. The question then becomes:
Is the layered Moho seen in the model and on most deep-crustal reflection data a reality,
or an artifact of complex wave-propagation through the mid- and upper crust?
- Spatial aperture (maximum offset) limitations made little difference in the migrated
results, with a slight increase in dispersion noticeable. This is a direct consequence of
the direct connection between spatial and temporal frequency, with a limitation of the
spatial aperture producing a band limitation in the frequency domain and leading to
greater dispersion.
Back to top Go To Main Page
- 3-D gravity modeling algorithms
- Dr. C. Çoruh and I have spent some time working on 3-D gravity modeling algorithms
for Mathematica and a spreadsheet. Both apply spatial filters on layers of density
to calculate the gravitational attraction of a small 3-D cube at depth, with the
difference being that the Mathematica program works in the frequency domain via
FFT's, and the spreadsheet program works in the space-domain. Both algorithms work well,
though the 2-D spatial filtering of the spreadsheet modeling program could take a
substantial amount of time depending on the desired accuracy of the solution. Dr. Çoruh
is currently working on converting the original spreadsheet modeling program into a
Microsoft Excel application.
- Short-Time Fourier Transform (STFT) study
- Another project which has shown some promise is the application of the Short-Time
Fourier Transform (STFT) or f-tau transformation in the processing and interpretation of
Vibroseis and well-log data. The STFT works by calculating the Fourier amplitude spectrum
over small portions of a data trace, i.e. windowing. The process is repeated over the
entire length of the trace by shifting the window by small increments. A criteria I use to
determine if the window width and increment are chosen properly is to reconstruct the data
trace. The parameters that best allow a proper reconstruction of the original trace are
the ones used. The original idea was to use the STFT to remove correlation artifacts from
vibroseis data in a manner similar to Okaya and others (Geophysics, July 1992).
However, as I delved deeper into the project, I discovered that their method was probably
removing a portion of lower frequency signal from the data, in addition to the harmonic
energy. I decided to try and find a better way of filtering the data. A paper by Li and
others (Geophysics, March-April 1995) on the removal of correlation artifacts from
recorded sweeps has given me some ideas about removing such artifacts from recorded data.
Unfortunately, the main dissertation project has intervened and prevented me from pursuing
what appeared to be a fruitful line of research.
- Application of the STFT technique to well-log data has been moderately successful. My
work with Anna Balog and Mike Pope (former students of Dr. J.F. Read) on pr imarily gamma
ray logs has shown that the STFT may have some utility in regional correlation of units or
in the identification of cyclicity in carbonate/shale sequences. We were able to show that
the Triassic strata in Hungary exhibited cyclicity throughout the preserved record,
leading Anna to a model in which a change in climate and not sea-level fluctuations might
explain the change from dolomite to limestone in her basin. Mike Pope and I discovered
pronounced zones in cyclicity in well logs from the Ordovician strata of the Appalachian
Basin. If these zones can be correctly correlated with outcrop or well-lithologic
information, then it may be possible to perform regional correlations of those units using
STFT's of gamma ray logs.
- Recently (July, 1996), I have been using the short-time Fourier transform technique to
convert stacked seismic data into a 3-D cube of amplitude and phase information. The
multi-trace STFT algorithm allows one to view the variability of amplitude and phase with
time for not only a single trace, but along an entire line. Time, or frequency slices can
be made using a companion program, although I plan on making it part of the total package.
- Pseudomagnetic field constraints on potential field
anomalies
- Constraints on the source of potential field anomalies can be found by using
pseudomagnetic fields. The technique was developed by Dr. E.S. Robinson as a alternative
to the pseudogravity method of Baronov. A 2-D spatial filter converts gravity data into
magnetic data using Poisson's Relation. If the gravity and magnetic fields are produced by
the same body, the pseudomagnetic field will match the real magnetic field. If the sources
are not the same, then the fields will not match. Along with the development of a more
efficient algorithm for determining the pseudomagnetic field, my development of a a 2-D
map normalization and comparison program was instrumental in the application of the
technique by Debbie Hopkins and I to three well-known geophysical anomalies: the
Mid-Continent Rift, the Eastern Virginia Geophysical High (EVGH; discussed above), and the
New York - Alabama Magnetic Lineament Anomaly (NYALA). The results showed that the gravity
and magnetic fields of the Mid-Continent Rift and the EVGH had the same sources as
expected, but the NYALA has been a more difficult task, particularly since the source of
the anomaly lies in the sub-thrust basement, and attempts at residualization have been met
with mixed results. Dr. Hopkins has been working on this particular problem, and she I are
currently working on a paper about our results.
- Dip-projection of reflection seismic data
- One of the major problems in reflection seismology is processing and interpreting
data collected along crooked profiles -- especially in mountainous regions. In addition to
the geometry and statics problems, the crooked-line section generates areas of both low
and high fold, and a finished section that is difficult to interpret as various parts of
the line are oriented in different directions. Migration algorithms work best on seismic
data that is exclusively down-dip, and the algorithms have difficulty moving the
reflections back to their proper space-time location.
- Dr. Costain developed the idea of "strike-binning", which involves
reprocessing crooked-line data by projecting the data onto a line that in the dip
projection. The technique involves completely reprocessing the data from scratch after the
new geometry is set up. While this is effective in getting the data onto a dip line, the
fold is still highly variable, with fold in the former 'strike' areas often > 200.
- What I have done is to streamline the process by projecting pre-processed CDP's gathers
-- filtered, deconvolved, and statics corrected -- onto the new, straight, dip-directed
CDP line. A second inovation is the use of small bins -- 1/5 the size of ordinary CDP bins
(e.g. 10m instead of 50m). The smaller bin size solves two problems: it reduces the fold
in the strike areas and allows the gathering of smaller fold CDP's into CDP's of more even
fold. Care must be exercised, however, to make sure that the gathers contain traces that
are from shot-reciever pairs that are associated with each other; therefore there are
never more than five 10m CDP's gathered at a time. After editing (to remove common offset
traces within gathers), stacking, and interpolation (to make the CDP distances equal), the
data are gathered once more into 50m CDP's. The finished section is easier to interpret,
and should migrate better because it is now a true dip line. Both model and real data have
been processed in this manner with good results. {Recently Accepted by Geophysics}
Back to top Go To Main Page
GSW
Geology and Physics Homepage
Samuel T. Peavy
Department of Geology and Physics
Georgia Southwestern State University
Roney 208
800 Wheatley St.
Americus, GA 31709
E-mail: speavy@canes.gsw.edu
Last updated: 08/10/04